

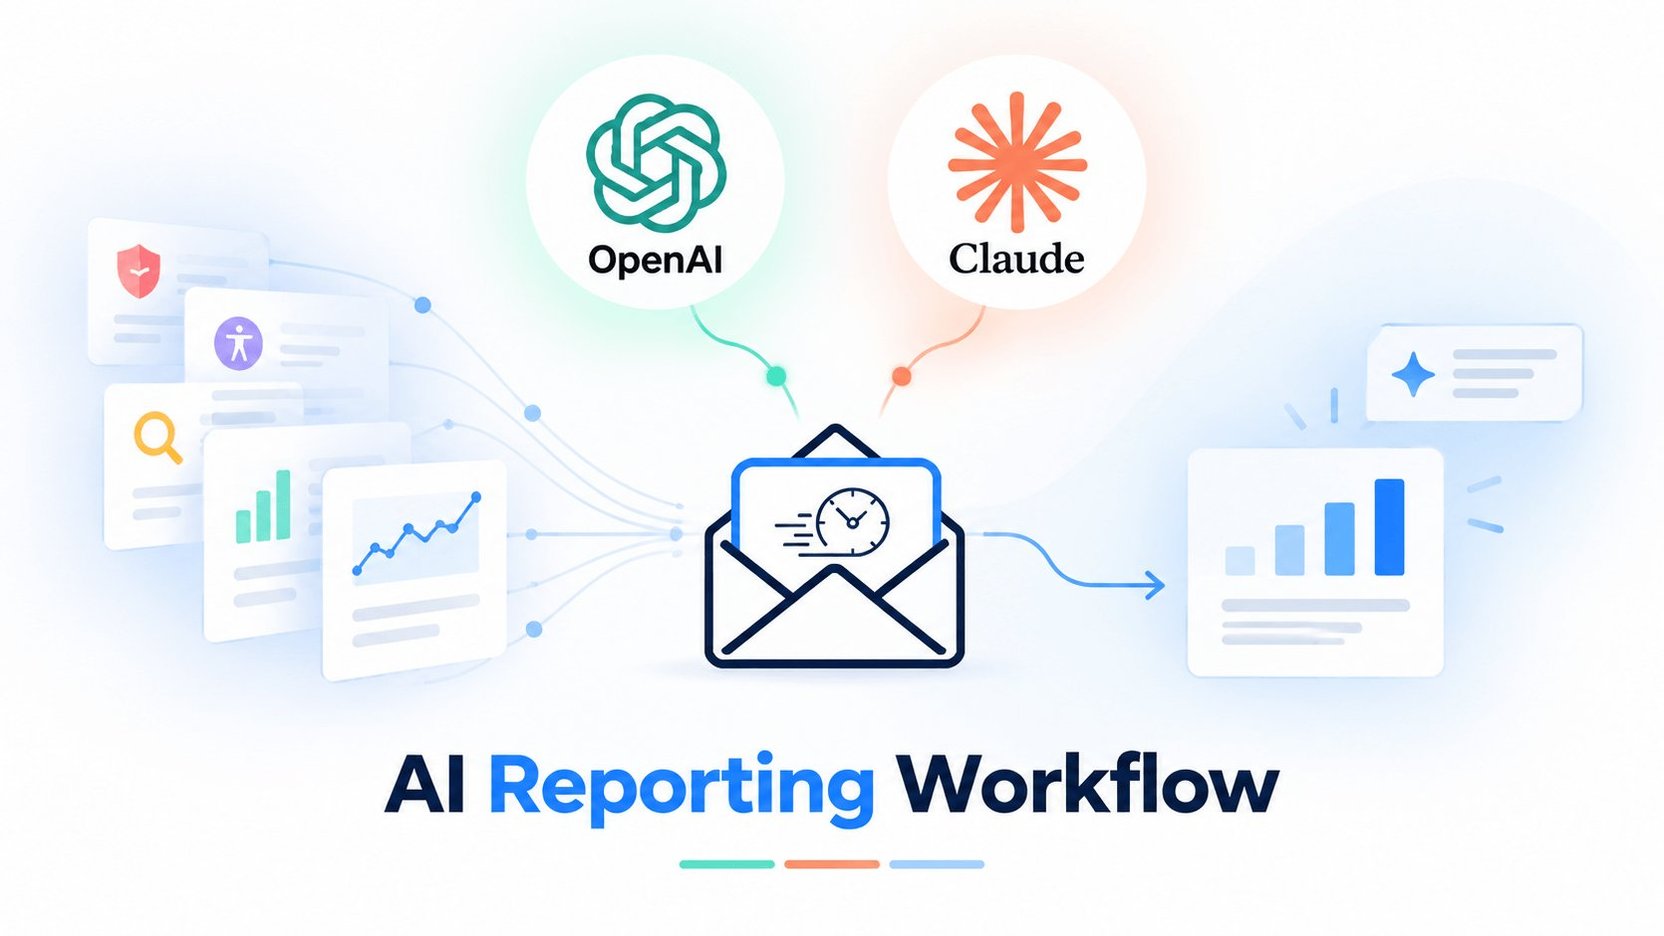
A single report tells you what happened at one moment. A history of reports gives you context.
At WebPerformance Report, reports are delivered directly to the inbox. Over time, those deliveries become a reporting history across dimensions such as Performance, Security, Accessibility, Analytics, and Search.
With AI assistants such as Claude or ChatGPT, that reporting history becomes something you can explore conversationally.
Instead of opening reports one by one, you can ask questions, compare periods, identify trends, generate charts, and explore how different dimensions of digital performance may relate to each other.
How the AI Reporting Flow works
The basic workflow is simple.
No MCP required. No custom integration required.
Using Claude as an example:
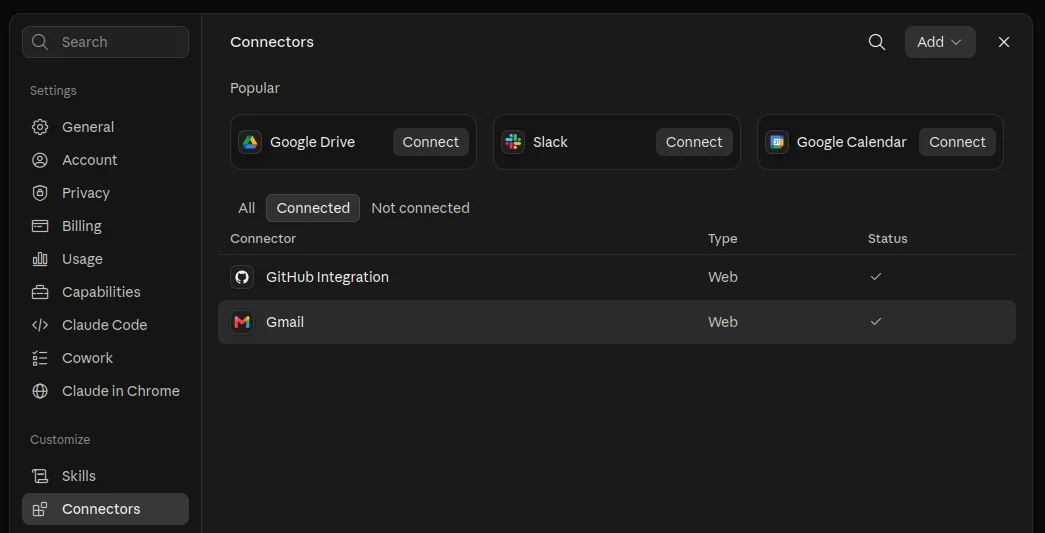
1. Connect your email
Enable the Gmail or Microsoft integration in your AI assistant and connect the inbox where your WebPerformance Report deliveries are received.
2. Find your WPR reports
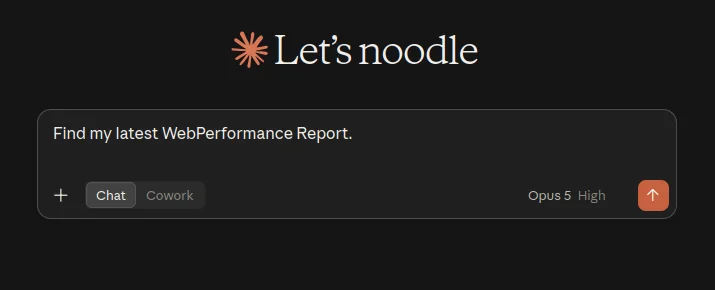
Ask the assistant to retrieve your recent deliveries.
For example:
Find my latest WebPerformance Report.
Or:
Find my WebPerformance Report deliveries from the last 30 days.
3. Start asking questions
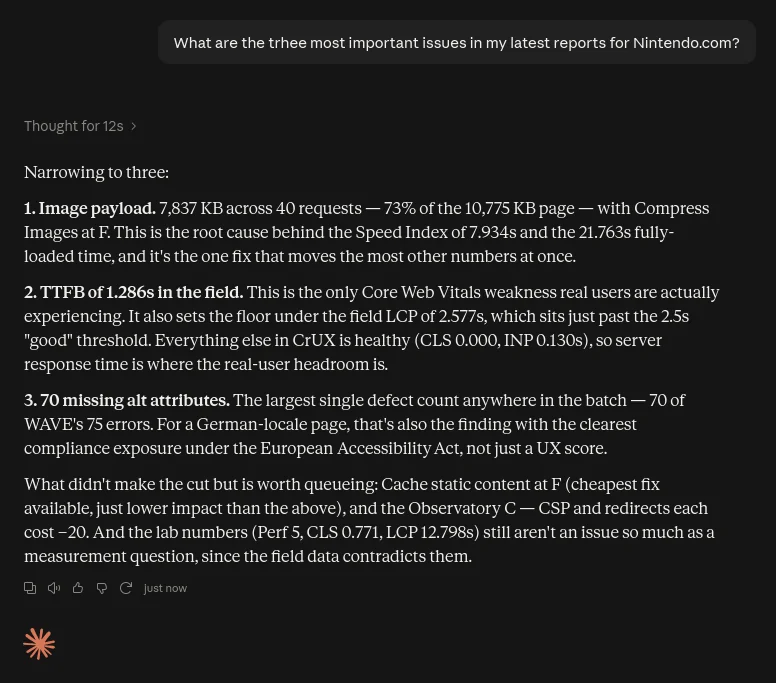
Once the reports are available, you can begin analyzing them naturally.
For example:
What are the most important issues in my latest reports?
Or:
What should I prioritize first?
4. Go deeper with your report history
The workflow becomes more useful when several deliveries are analyzed together.
For example:
Analyze my last four WebPerformance Report Performance deliveries. Compare LCP across the four reports, identify the main changes or trends, explain what they could mean, and create a bar chart showing the evolution of the metric over time.
The assistant can retrieve the relevant reports, compare the values, explain the trend, and visualize it.
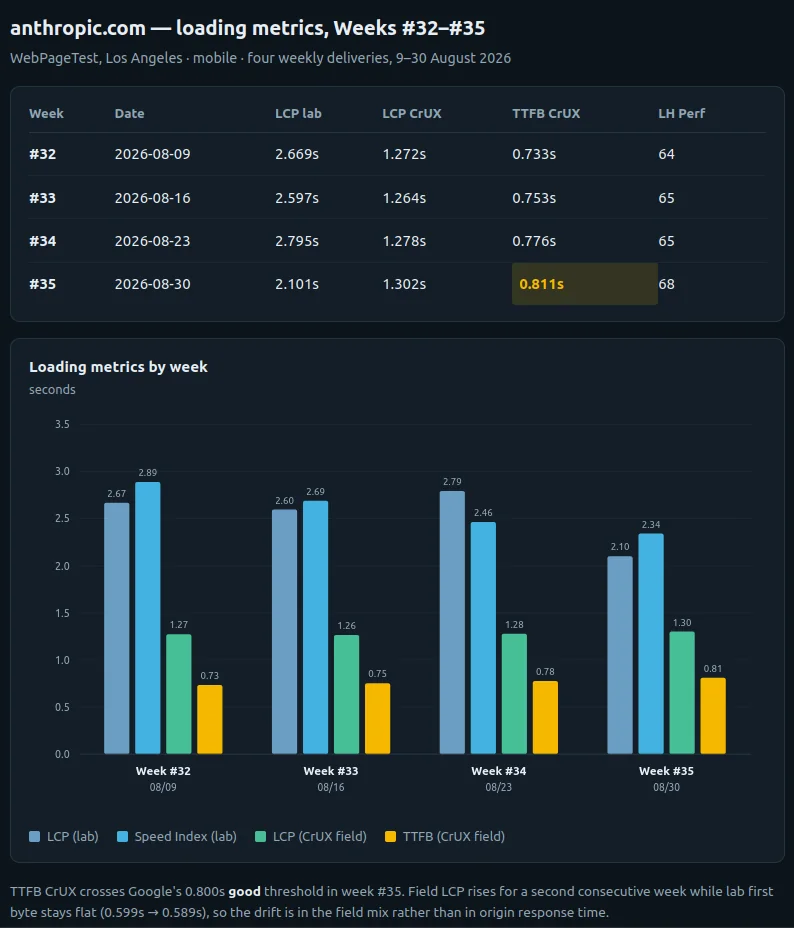
One prompt. Four reports. One clear performance trend.
One website. Multiple dimensions. One conversation.
The real potential goes beyond analyzing a single metric.
A website is affected by multiple dimensions at the same time. Performance influences how quickly users can interact with it. Search affects visibility. Analytics shows how visitors behave. Accessibility affects who can use the experience. Security influences trust.
Traditionally, these signals live in different tools and dashboards.
WPR brings them into a common reporting history. AI makes that history easier to explore together.
This makes it possible to ask broader questions:
- Did engagement change during the same period in which performance improved?
- Did organic visibility move in the same direction as Core Web Vitals?
- Which websites combine performance, accessibility, and security risks?
- What changed across Performance, Search, and Analytics during the last month?
The goal is not to assume causation. It is to surface patterns, correlations, and questions worth investigating.
The value grows when reports can be understood together.
Why this matters for managers
For technical teams, AI can help explore metrics and trends in more detail.
For managers, the same reporting history can support broader questions:
Which website needs attention first?
What changed across our digital experience this month?
Which issues should we prioritize from a business perspective?
That means less switching between dashboards, more historical context, and a clearer path from technical data to prioritization and executive communication.
The same reports can support a technical analysis, a management summary, or a broader view of digital performance depending on the question being asked.
Explore the AI Reporting Flow
We have published two resources for anyone who wants to explore the concept further.
AI Benchmark Artifact
See a real example of how reporting data can evolve into a benchmark and executive-oriented output.
See the AI Benchmark Artifact →
Open-source WPR AI Reporting Flow
The repository contains reusable instructions, workflow guidance, and examples for taking the concept further.
Explore the WPR AI Reporting Flow →
The Artifact shows the result. The repository shows the method.
The report is where the next step begins
A report should not be the end of the workflow.
It should lead to understanding, prioritization, decisions, and ultimately results.
AI expands what can happen after the report is delivered.
A report can become context for the next question. A history of reports can become context for understanding change. And multiple reporting dimensions can become part of the same conversation.
The report delivers the context. From there, the conversation and the decisions begin.
Reports. Decisions. Results.
Get your own report