
Reports. Decisions. Results.
Google Analytics 4 Report
Web analytics report delivered directly to your inbox.
Traffic numbers only mean something next to last week’s. Every report sets them side by side, so a channel drying up or a page losing its audience shows up while you can still act on it. Pulled from your Google Analytics 4 property, and no dashboard to log into.
Available from the Lite plan. Set up from your Board. Built on top of Google Analytics 4
Sponsored by

Trusted by teams at Google, Airbnb, Stripe, IKEA, Nestlé and dozens more global brands.

Set up from your Board
Available from the Lite plan onwards
Connect a single Google Analytics property or several of them, each one set up as its own report, with its own recipients and its own schedule: daily, weekly or monthly. You can also send it as a One Time Report when you only need a single snapshot.
Every report lands direct in your inbox, covers the period you choose and compares it with the one before, so the numbers turn up with context already attached and nobody has to log in to a dashboard to read them.
Subscribe from your BoardNot on a paid plan yet? Compare all plans
I love having a weekly reminder of the Web Performance of my site, as another checkpoint that I’m not letting things regress, Also look forward to the featured links in case I missed anything in the webperf world in the last week.
WPR provides an easy way for me to observe and share simplified performance monitoring results with other engineers. Compared to other solutions, WPR just gets to the point with the data you need.
A snapshot report that provides valuable insights to help you focus on your website’s performance, based on data, makes it a worthwhile choice, especially considering such factors influence SEO.
Google Analytics is the most widely used analytics platform on the web. It is the standard choice for companies of every size, from personal sites and small businesses to large enterprises and global brands, and for most teams it is where their traffic numbers come from.
Google Analytics 4 is the current generation of that platform, and the successor to Universal Analytics. It is designed to measure websites and apps together, so a visitor's journey can be followed across platforms rather than split into separate reports.
GA4 is built on an event-based model: every interaction, from a page view to a purchase, is recorded as an event with its own parameters. That model is what powers its reports on acquisition, engagement, monetization, retention, user attributes and technology.
It is also designed for a web with fewer cookies and stronger privacy expectations, using aggregation and modelling to fill gaps in the data. The standard version is free to use and connects with tools such as Google Ads, Search Console and BigQuery.
We are really proud that our users also come from big companies and big brands around the world and are using Web Performance Report to monitor the web performance of their websites every week from their inboxes. 🎉




































Five reports, one subscription. Pick the ones that matter to your site. Each has its own recipients and schedule.
WebPageTest Report
The gold-standard open-source performance tool. Core Web Vitals, filmstrip, request map.

HTTP Observatory Report
Mozilla’s in-depth assessment of your HTTP headers and security configuration.

WAVE Report
The accessibility barriers on your pages, checked against standards such as WCAG, ADA and the EU Accessibility Directive.

GA4 Report
Your traffic numbers set against the period before, so a channel drying up shows up while you can still act on it.
Search Console Report
Impressions, clicks, positions and the queries bringing visitors in from organic search.

Want all five?
Every report type is unlocked on the paid plans, each with its own URLs, recipients and schedule.
See PlansAnalytics Report Details
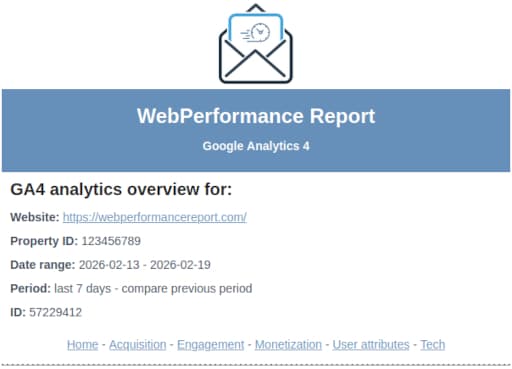
Website, GA4 property, date range and comparison period, so everyone reading the report knows exactly what the numbers cover.
Analytics Summary
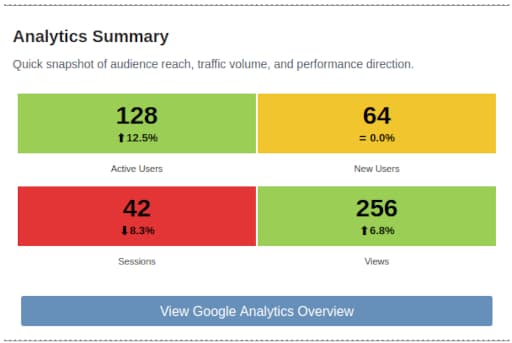
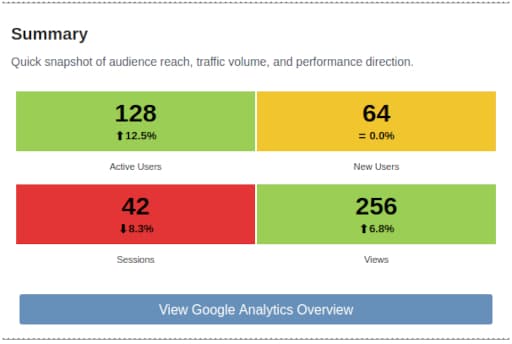
A quick snapshot of audience reach, traffic volume and the direction each metric is moving compared with the previous period.
Device Category
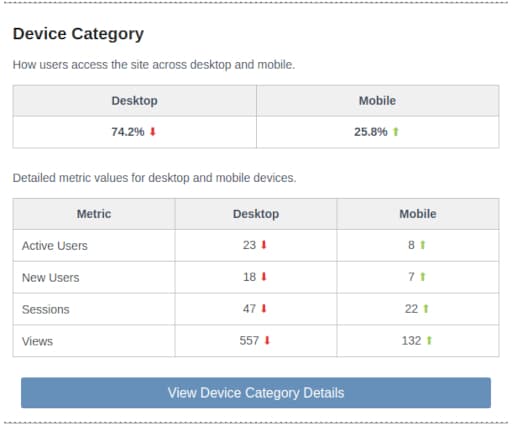
See how your audience splits across desktop, mobile and tablet, and spot when one device starts behaving differently from the rest.
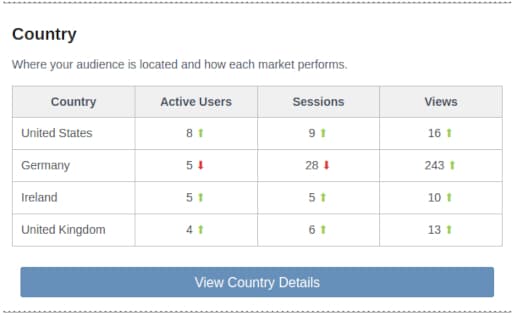
Country Breakdown
Where your visitors are located, so you can see which markets are growing and where your content is finding an audience.
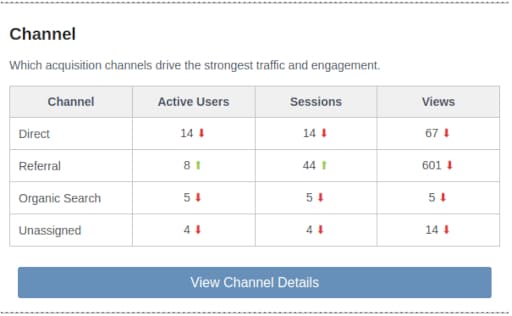
Acquisition Channels
Which channels bring people to your site: organic search, direct, referral, social and paid, with the change against the previous period.
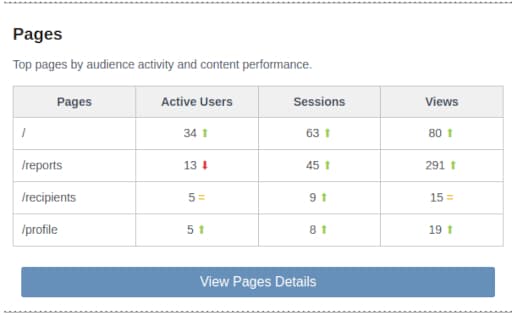
Top Pages
The pages people actually visit, ranked by traffic, so you can tell which content is working and which needs attention.
Get in touch: info@webperformancereport.com

Reports. Decisions. Results.
(stable version 😊)