

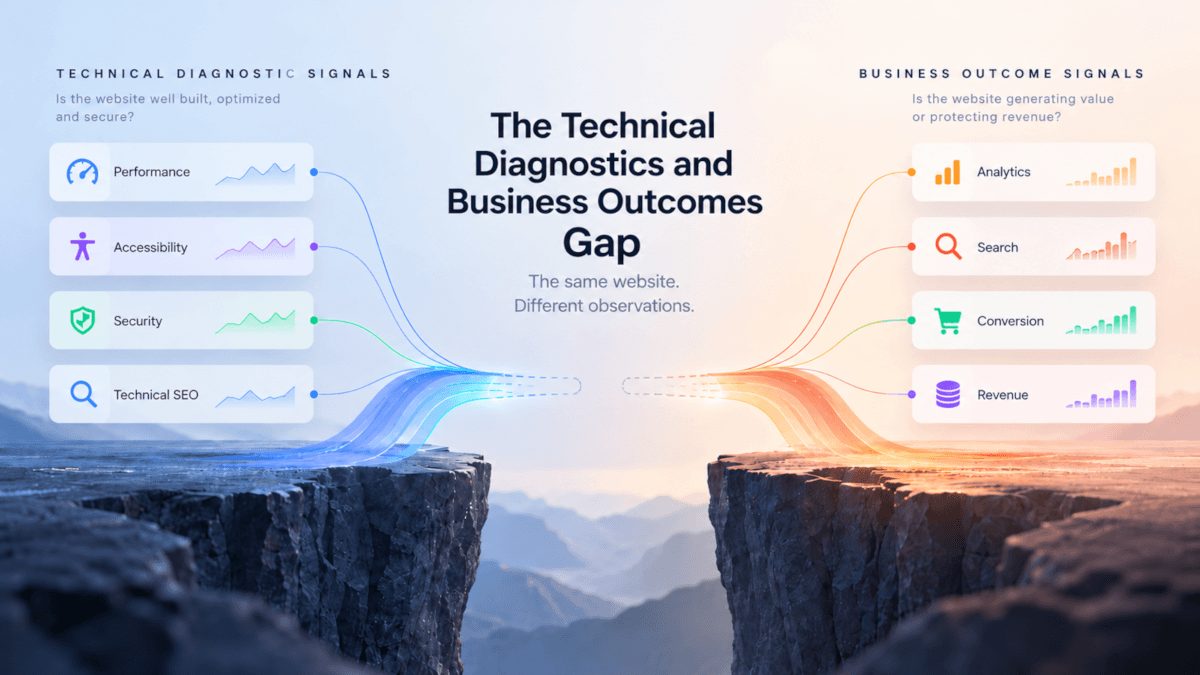
Why connecting technical diagnostics to business outcomes matters more than collecting another metric.
We have become extremely good at measuring websites. Performance can be analyzed in detail with tools such as WebPageTest. Accessibility can be evaluated against WCAG criteria. Security headers and configurations can be inspected. Google Analytics shows how users behave. Google Search Console reveals how websites perform in organic discovery. Commerce platforms track transactions and revenue.
There is no shortage of data. Salesforce's State of Data and Analytics report, based on responses from nearly 8,000 executives, found that data and analytics leaders estimate organizational data volumes are growing by 25% annually. Yet 54% of business leaders are not fully confident that the data they need is accessible. [1]
More data does not automatically create more understanding. The web does not have a measurement problem. It has a connection problem.
On one side, technical diagnostic tools tell us what is happening inside the website. On the other, analytics and business platforms show what is happening with users, traffic, conversion, revenue and risk. Both observe the same digital system, but their outputs are often consumed by different people, in different tools and through different workflows.
The gap is not simply between platforms. It is between interpretations.
Technical diagnostics and business outcomes are two views of the same website
The first side of this landscape contains primarily diagnostic signals. These help technical teams understand the condition of the website itself. Is it fast? Is it accessible? Is it secure? Did a deployment introduce a regression? Are technical standards being followed?
Tools such as WebPageTest, WAVE and Mozilla Observatory provide evidence for these questions. Their users are often developers, technical leads, QA teams, system administrators and engineering managers. Their outputs may include LCP, TBT, accessibility violations, security headers or configuration issues.
The second side contains primarily outcome signals. These help organizations understand what is happening around the website from a user or business perspective. Is organic traffic increasing? Are users converting? Has engagement changed? Is revenue growing? Are users abandoning an important journey?
Platforms such as Google Analytics, Google Search Console and commerce analytics systems provide this perspective. Their users are often ecommerce managers, marketers, growth teams, product managers and executives.
The boundary between these worlds is not absolute. Performance metrics can have commercial relevance. Search Console contains technical information. Analytics can help investigate technical problems. Accessibility affects both implementation quality and user experience. Security findings may represent technical weaknesses and broader business risk.
But operationally, these signals are still commonly separated. That separation matters because diagnostic signals and business outcomes can describe different parts of the same event.
When diagnostic signals become business signals
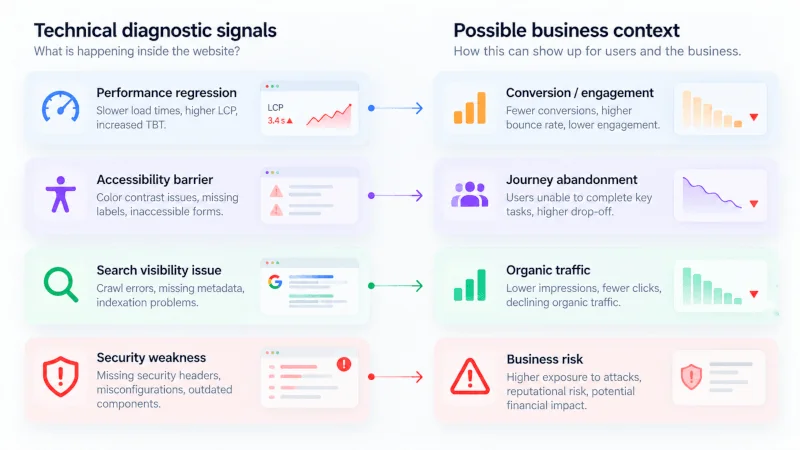
Imagine that a deployment goes live on Tuesday. WebPageTest later shows that LCP increased from 2.1 seconds to 3.4 seconds. During the same period, analytics show that conversion decreased by 12%, while Search Console shows a change in organic performance.
These signals may be related, or they may have completely different causes. A slower website does not prove that the conversion decline was caused by performance. Correlation is not causation. But seeing those changes together creates something valuable: a concrete hypothesis worth investigating.
There is good reason to examine these relationships. In Milliseconds Make Millions, research commissioned by Google and conducted by Deloitte found that a 0.1 second improvement in mobile site speed was associated with an 8.4% increase in retail conversion rates and a 10.1% increase in travel conversion rates across the sites studied. [2]
The point is not that every performance improvement produces the same commercial result. It is that technical performance and commercial outcomes can be connected closely enough that looking at them separately can hide useful context.
Accessibility provides another example. A technical accessibility report may identify poor color contrast, inaccessible forms, missing labels or keyboard navigation problems. To a diagnostic system, these appear as technical findings. To a person trying to use the website, they can become an inability to navigate, complete a form, authenticate or make a purchase.
The 2019 Click Away Pound research found that 69% of participants with access needs said they would leave a website when they encountered accessibility barriers, while 83% said they limited their online shopping to websites they knew were accessible. [3]
Again, an accessibility violation does not translate automatically into a specific amount of lost revenue. But it demonstrates the same pattern: a technical team may see an accessibility issue, analytics may show abandonment, and the business may see fewer completed transactions. These can be different observations of the same user experience.
Security introduces a similar relationship from another direction. A missing security header or weak configuration may not immediately produce a visible movement in conversion or traffic, but it can represent exposure to operational, reputational or financial risk. Not every diagnostic signal has an immediate analytics counterpart. Business outcomes include both realized results and risks being protected against.
The hidden cost of fragmentation
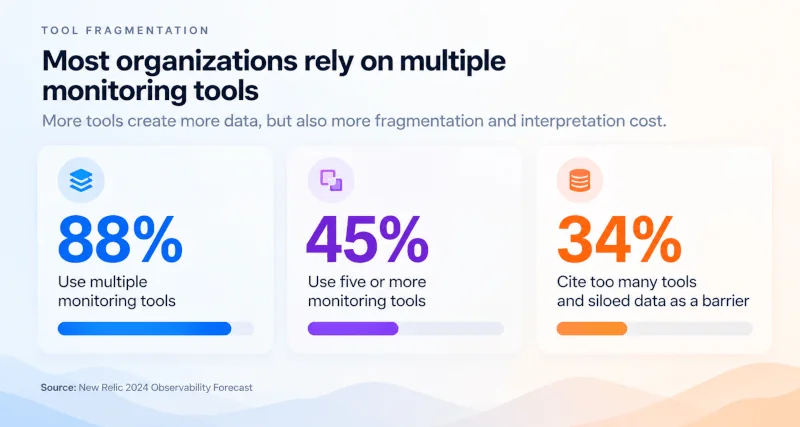
The proliferation of specialized tools is real. New Relic's 2024 Observability Forecast found that 88% of respondents used multiple monitoring tools and 45% used five or more. More than a third, 34%, identified too many monitoring tools and siloed data as a barrier to achieving full stack observability. [4]
The number of tools, however, is only part of the problem. Every disconnected system also creates interpretation cost. Someone must understand its output, compare it with evidence from other systems and place it in a wider context.
Inside organizations, this creates decision friction. Engineering may report that the site is technically healthy while ecommerce reports falling conversion. Marketing may see declining organic traffic without knowing that a technical change occurred during the same period. Security may identify a weakness whose relevance is never translated beyond the technical team.
IBM has cited research from its Institute for Business Value in which nearly 77% of respondents agreed that data silos hinder their organization's ability to perform real time analytics and make data driven decisions. [5]
Each team can therefore be correct within its own information system while the organization still struggles to understand what is happening as a whole.
When senior specialists become human APIs
The problem becomes especially visible in agency client reporting. Agencies and consultancies use specialized tools because their clients expect specialized expertise, but senior specialists can easily find themselves performing repetitive work: extracting data, checking different platforms, comparing periods, collecting screenshots, preparing presentations and explaining how the pieces fit together.
The consultant effectively becomes a human API between disconnected systems.
Evidence from the wider data industry shows how persistent this manual layer remains. Alteryx reported that 76% of surveyed data, IT and operations professionals still relied on spreadsheets for data preparation, while 45% spent more than six hours per week on data cleansing and preparation. [6]
The context is broader than web performance reporting, but the pattern is relevant. Sophisticated systems gather data while skilled people still spend significant time preparing, connecting and translating it. For agencies, that interpretation cost can become margin erosion because hours that could be spent investigating problems, developing strategy or advising clients are instead consumed by mechanical reporting work.
There is also a commercial consequence. Highly technical work can be difficult for clients to value when its relevance is not translated clearly. A consultant may improve LCP, fix accessibility violations, strengthen security headers or resolve crawl issues, but if the client cannot see how those changes relate to customer experience, discoverability, risk or business outcomes, the value remains abstract.
AgencyAnalytics' 2025 survey of more than 220 agency leaders found that 70% rated client reporting as extremely important for client retention. [7]
Reporting is therefore not merely an administrative task. It is part of how technical work becomes visible and understandable to the client.
When that translation fails, a simple question can appear: What exactly are we paying for?
Why another dashboard is not enough
A natural response to fragmentation is centralization. Put everything in one dashboard.
That can solve an important problem: location. It reduces the number of places someone has to visit. But centralizing metrics does not automatically solve interpretation.
A dashboard can place LCP beside conversion rate, accessibility findings beside abandonment data, or security scores beside business KPIs. Someone still has to determine what changed, what changed at the same time, which relationships matter and what should be investigated next.
Centralizing data is not the same as synthesizing meaning.
That distinction leads to a different question. Instead of asking how to collect more information or place more metrics on one screen, we can ask how the information we already collect can be transformed into useful context.
From raw data gathering to the synthesis layer
Much of the innovation in digital measurement has focused on the raw data gathering layer, and with good reason. We can now collect performance metrics, accessibility violations, security signals, search data, user behavior and commercial outcomes with extraordinary precision.
But gathering signals is only the first stage. The next challenge is the synthesis layer.
The synthesis layer does not replace the systems that gather evidence. It brings their outputs into context, aligns relevant changes, identifies relationships worth investigating and translates fragmented observations into information that different stakeholders can understand.
Raw Data Gathering → Synthesis → Decision → Action
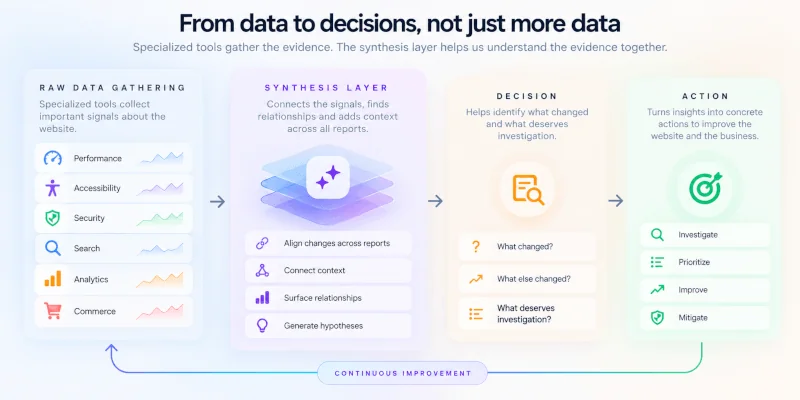
The first layer is already highly automated. The synthesis layer frequently is not. It is still often performed by people moving between systems, aligning dates, interpreting specialized metrics and translating the result for other teams.
This is also where different professional languages meet. Developers think about regressions and technical constraints. Accessibility specialists think about barriers and standards. Security teams think about exposure and risk. Marketing thinks about acquisition and engagement. Ecommerce thinks about conversion and revenue. Executives think about investment and outcomes.
They do not need to use the same tools or become experts in each other's disciplines. They need enough shared context to understand how their observations relate to the same digital system.
Measurement tools collect signals. The synthesis layer connects them into context.
Where WebPerformance Report fits
This is the space where WebPerformance Report is evolving.
WPR started with a simple idea: instead of requiring people to repeatedly visit specialized dashboards, relevant reports should move toward the people who need them. The specialized sources remain specialized, while reporting provides a consistent way to consume their outputs.
With Single Setup, a website becomes the common object around which Performance, Accessibility, Security, Analytics and Search reporting can be organized. The objective is not tool consolidation for its own sake. It is context consolidation.
With Cross Report Analysis, the question can move beyond an isolated metric. Instead of asking only “What happened to LCP?” or “What happened to conversion?”, we can ask: What changed, what else changed during the same period, and what should we investigate?
The same approach can extend to accessibility, search and other reporting dimensions. If an accessibility report identifies barriers in an important user journey while analytics show unusual abandonment during the same period, those signals can be examined together. This does not establish causation. It establishes context for investigation.
AI assisted reporting should therefore not manufacture certainty. Its role should be to surface relevant relationships, establish context and help people investigate complex evidence more efficiently. The AI reporting workflow shows what that looks like in practice.
Distribution matters as well. Traditional dashboards assume that users will log in, navigate the platform, select the correct period and determine whether something deserves attention. That workflow works for specialists who use those systems every day, but less well for executives, clients and other stakeholders who need periodic visibility.
Scheduled reporting reverses that model by moving information toward the person. The inbox becomes the consumption layer, while the Management Board handles configuration, recipients, delivery history and governance.
The inbox is for consumption. The Management Board is for governance.
We have become good at gathering signals. Now comes synthesis.
The web industry has become remarkably good at observing digital systems. We can measure performance, audit accessibility, inspect security, analyze traffic, track search visibility, measure conversion and observe revenue.
What remains difficult is understanding those signals together.
Technical diagnostics and business outcomes are not separate realities. They are different observations of the same digital system. The missing layer is often the context that connects them.
WebPerformance Report is being built around that idea. Specialized tools gather the evidence. The reporting and synthesis layer helps make that evidence understandable together.
The next improvement in web intelligence may not come from measuring one more thing.
It may come from connecting what we already measure.
References
- Salesforce, State of Data and Analytics
- Deloitte and Google, Milliseconds Make Millions
- Click Away Pound 2019, accessibility and online shopping research
- New Relic, 2024 Observability Forecast
- IBM Institute for Business Value, research on data silos and decision making
- Alteryx, 2025 research on data preparation and spreadsheet usage
- AgencyAnalytics, 2025 Marketing Agency Benchmarks Report